
Livestock distribution maps-Species
This section provides an indication of the density and distribution of livestock in various regions. Not all regions are presented, but as is the case with other sections, maps are continuously updated.
Maps were prepared by Kai Sonder (ILRI Addis Ababa, Ethiopia)
Disclaimer: Maps were drawn using the information available at the time of preparing this version of the AGTR. Maps will be updated in future versions when additional information becomes available.
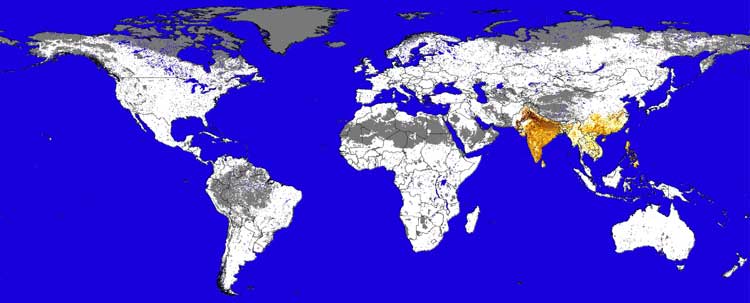
| Unsuitable for Ruminants | Cattle | |||||
| Unsuitable | <1 | 20-50 | ||||
| 1-5 | 50-100 | |||||
| 5-10 | 100-250 | |||||
| 10-20 | 250+ | |||||
All densities are in heads per km2
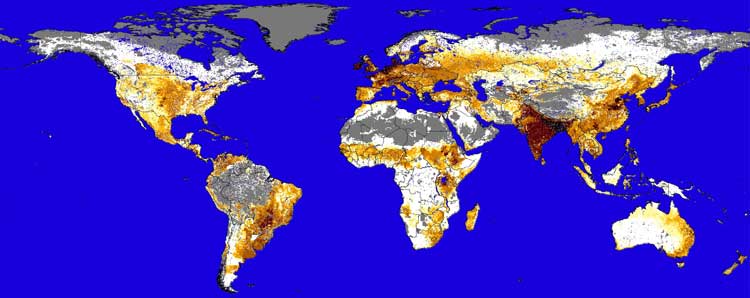
FAO (2005). Global Livestock Distributions. Data Archive produced by Environmental Research Group Oxford Ltd for the Food and Agriculture Organisation of the United Nations, Rome.
Year 2000 Corrected Predictions 5km resolution
| Unsuitable for Ruminants | Cattle | |||||
| Unsuitable | <1 | 20-50 | ||||
| 1-5 | 50-100 | |||||
| 5-10 | 100-250 | |||||
| 10-20 | 250+ | |||||
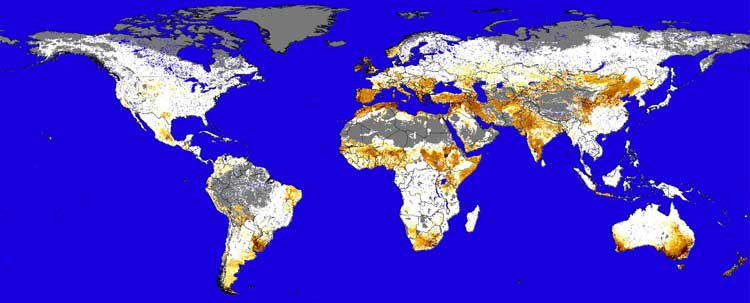
FAO (2005). Global Livestock Distributions. Data Archive produced by Environmental Research Group Oxford Ltd for the Food and Agriculture Organisation of the United Nations, Rome.
Year 2000 Corrected Predictions 5km resolution
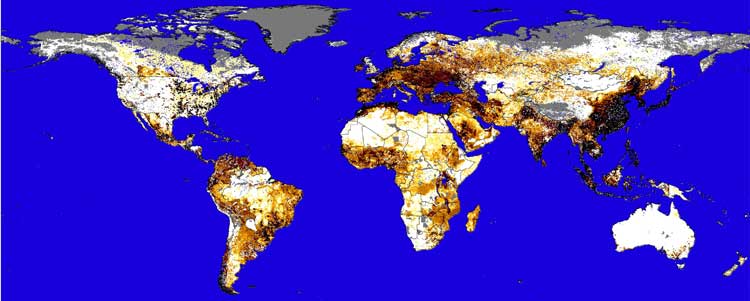
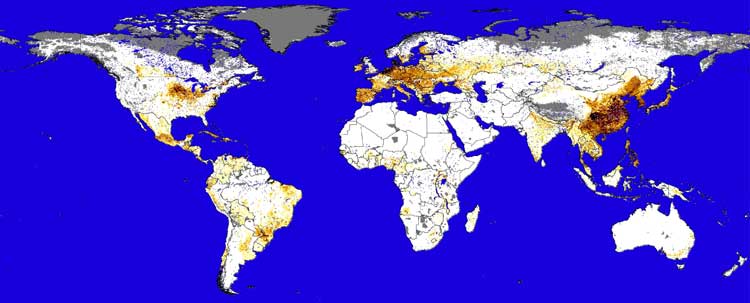
| Unsuitable for Ruminants | Cattle | |||||
| Unsuitable | <1 | 20-50 | ||||
| 1-5 | 50-100 | |||||
| 5-10 | 100-250 | |||||
| 10-20 | 250+ | |||||
FAO (2005). Global Livestock Distributions. Data Archive produced by Environmental Research Group Oxford Ltd for the Food and Agriculture Organisation of the United Nations, Rome.
Year 2000 Corrected Predictions 5km resolution